The datapine Blog
News, Insights and Advice for Getting your Data in Shape

Search Results for: kpi

Found 148 search results for kpi (this is page 25 of 30).

Dashboard Storytelling: From A Powerful To An Unforgettable Presentation

woman presenting dashboard to her colleague

Plato famously quipped that “those who tell stories rule society.” This statement is as true today as it was in ancient Greece – perhaps even more so in modern times.

In the contemporary world of business, the age-old art of storytelling is far from forgotten: rather than speeches on the Senate floor, businesses rely on striking data visualizations to convey information, drive engagement, and persuade audiences. 

By combining the art of storytelling with the technological capabilities of dashboard software, it’s possible to develop powerful, meaningful, data-backed presentations that not only move people but also inspire them to take action or make informed, data-driven decisions that will benefit your business.

READ MORE

Seize The Power Of Customer Data Management – Best Practices

Customer data management by datapine

“Get closer than ever to your customers. So close that you tell them what they need well before they realize it themselves.” – Steve Jobs

We’re living in the midst of the age of information, a time when online data analysis can determine the direction and cement the success of a business or a startup that decides to dig deeper into consumer behavior insights. In the digital age, knowing your customers on a more personal level is the most effective way of developing marketing communications, customer service reports or initiatives that offer genuine value and yield real results. By managing customer data the right way, you stand to reap incredible rewards.

READ MORE

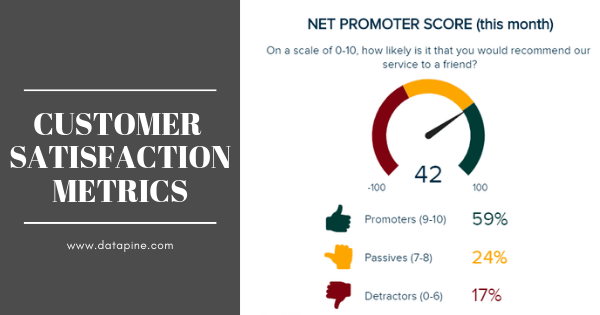
Take Charge Of Customer Satisfaction Metrics – Customer Effort Score, NPS & Customer Satisfaction Score

Customer satisfaction metrics and examples
“There’s a certain way of creating a service, hospitality, and experience that perpetuates people feeling like they matter.” – Julie Rice, entrepreneur, and investor

Today’s tech-savvy customers are driven by experiences. Now more than ever, consumers look for trust, honesty, transparency, value, and an exemplary level of customer experience (CX) from brands they’re willing to invest in. This means that if you want to compete, you have to satisfy your audience consistently – and better than your competitors.

Forrester Research defines the ‘customer experience’ as: “How customers perceive their interactions with your company.”

Indeed, perception and interaction are the two most pivotal pillars of any customer experience – and exceptional customer experience often leads to improved customer satisfaction, a true catalyst for success in the digital age of business.

READ MORE

Take Advantage Of Mobile Dashboards – Examples & Selected Designs

Mobile dashboard examples and designs

We live in a mobile world. According to the statistics portal Statista, there are currently around 4.78 billion mobile device users worldwide. No longer are we bound by the shackles of cumbersome desktop PCs or one specific geographical location to conduct research or complete online data analysis or other important online tasks. In this hyperconnected age, it’s possible to connect, campaign, and produce from anywhere you may be in the world – and the mobile revolution is responsible for this seismic shift.

Mobile technology has changed the way we interact with the world around us, and when it comes to analyzing valuable business insights, mobile dashboards offer the freedom and flexibility to turn stats into success while you’re on the go.

Here, we will consider what a mobile dashboard is, the dashboard mobile design, making visualizations on mobile, and real business examples to explain the benefits this most flexible of data-driven technology can offer your business.

READ MORE

Data Science vs Data Analytics – Everything You Need To Know

Data science vs data analytics

At present, more than 3.7 billion humans use the internet. Moreover, we humans create 2.5 quintillion bytes of data every single day – a number that is expected to grow exponentially with each passing year.

Data never sleeps and in today’s world, without utilizing the wealth of digital information available at our fingertips, a brand or business risks missing vital insights that can help it grow, scale, evolve, and remain competitive.

Concerning the collection, understanding and handling of digital data, there are two key disciplines that currently lead the way: data science and analytics. Although these two fields cross over, and share many of the same characteristics, the two are strikingly different in many ways.

That said, to spare you any confusion and offer you a clearcut insight into these two innovative fields, here we explore data science vs data analytics in a business context, starting with an explanation of the science.

READ MORE