MASTER YOUR ANALYTICS JOURNEY IN ONE SINGLE PLATFORM
► Want to deep dive into over 150 business intelligence features? SeeHide all business intelligence features
| platform component | platform feature | description & benefits |
|---|---|---|
|
Connector
|
Databases
|
Connect all common databases such as MySQL, Oracle, SQL Server, Amazon Redshift and many more.
|
|
Connector
|
ERP / CRM
|
Easily integrate data from other ERP- or CRM systems such as Magento or SugarCRM.
|
|
Connector
|
CSV Import
|
Import CSV files from your local space or directly for your box, dropbox, google Spreadsheets or FTP Server.
|
|
Connector
|
Web Analytics
|
Connect external data from external web analytics tools such as Google Ads or Google Analytics.
|
|
Connector
|
Social Media
|
Integrate all your social media data from Facebook, Instagram, LinkedIn, Twitter, Youtube and many more.
|
|
Connector
|
Helpdesk
|
Connect your helpdesk data with a few clicks for advanced analysis, for example from Zendesk.
|
|
Connector
|
Custom APIs
|
Besides the standard data connectors, we offer customized API integrations to various applications.
|
|
Connector
|
Data Warehouse
|
Benefit from our high-speed data warehouse (dedicated servers), based in Frankfurt/Main Germany.
|
|
Connector
|
Data Extraction Assistant
|
This feature optimizes the transfer process when you store your data in our data warehouse.
|
|
Connector
|
Remote Connection
|
Connect datapine remotely to your own database(s) to stay in full control of your data storage.
|
|
Connector
|
Auto-modeling
|
datapine automatically identifies data types, schemas and existing foreign keys for smart data preparation.
|
|
Connector
|
Data Shema Options
|
Choose between pulling your whole database structure including all or only selected tables & fields.
|
|
Connector
|
SQL View
|
Our SQL view allows you to run pre-aggregations or calculations on your data before importing it.
|
|
Connector
|
Field Types
|
During the database connection you can change the field types (date, boolean, text & number fields).
|
|
Connector
|
Reference Editor
|
Join different data sources by defining individual relationships between your sources with foreign keys.
|
|
Connector
|
Label Editor
|
Change the displayed table and field names in datapine with the help of our label editor.
|
|
Connector
|
SSL Security
|
By default datapine is using an SSL connection, when you integrate your different databases.
|
|
Connector
|
SSH Tunnel
|
Connect to your database securely using an SSH Tunnel with a cryptographic network protocol.
|
|
Connector
|
VPN Connection
|
Set up an encrypted tunnel between our server and your database using VPN (IPSec or OpenVPN).
|
|
Connector
|
Update Interval
|
Define individual update intervals for your different connected data sources within datapine.
|
|
Analyzer
|
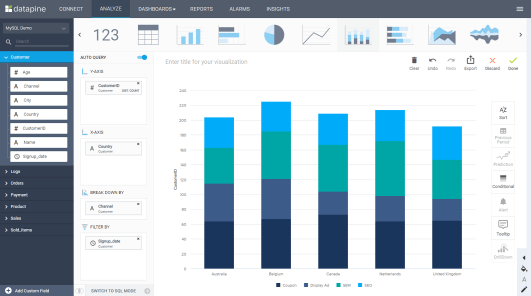
Drag & Drop Interface
|
Easily build charts & tables in an intuitive drag & drop user interface within seconds.
|
|
Analyzer
|
Ad-hoc Queries
|
Take advantage of ad-hoc queries & analysis to answer urgent business questions immediately.
|
|
Analyzer
|
Self-Service Analytics
|
Benefit from a wealth of self-service analytics features, that can be used without profound BI experience.
|
|
Analyzer
|
25+ Different Chart Types
|
Choose from over 25 modern chart types from stacked charts to maps to waterfall charts.
|
|
Analyzer
|
Calculated Fields
|
Clean and manipulate existing fields or create custom fields by drag & drop, based on individual formulas.
|
|
Analyzer
|
Expressions Library
|
Take advantage of over 80 predefined functions such as SUMIF, NPS, CONCAT or IIF.
|
|
Analyzer
|
Merged Fields
|
Merge different dimension fields with different join types (cross, left, right, inner join).
|
|
Analyzer
|
Cross-Database Queries
|
By setting up merged fields you have the possibility to make cross-data source queries in datapine.
|
|
Analyzer
|
SQL Mode
|
Build dynamic charts writing manual queries or using existing statements in any common database dialect.
|
|
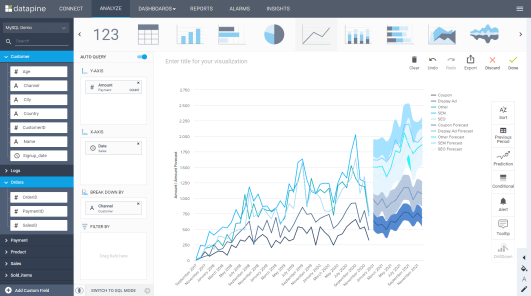
Analyzer
|
Auto Query
|
By default datapine instantly visualizes your drag & drop actions. If needed, you can turn off this option.
|
|
Analyzer
|
Duplication Wizard
|
Prevent row duplication when querying fields with one-to-many relationships with the duplication wizard.
|
|
Analyzer
|
Aggregation Types
|
Use different aggregation types, such as SUM, COUNT, AVERAGE, DIST. Count, MIN, MAX, MEDIAN or VARIANCE.
|
|
Analyzer
|
Split Result Set
|
Decompose your results according to certain criteria, splitting up your result set into different segments.
|
|
Analyzer
|
Running Total
|
You can use the accumulate over time function for charts to calculate the running total of any number.
|
|
Analyzer
|
Null Values
|
You have multiple options to include or exclude NULL values in your analysis for text, date or numeric fields.
|
|
Analyzer
|
Filters
|
Easily apply custom filter values to your data visualizations and exclude selected values, if needed.
|
|
Analyzer
|
Filter Raw Data |
Filter the underlying raw data with a few clicks using different operators: =, !=, <, >, is NULL, not NULL etc.
|
|
Analyzer
|
Limit Result Set (Threshold)
|
Sometimes it is necessary to limit the result set to get the right insights. A wealth of operators are available.
|
|
Analyzer
|
Group Results
|
Define custom groups to aggregate several values from one field into one group (e.g. DE, AT & CH = DACH).
|
|
Analyzer
|
Time Values
|
Modify time values of charts by different breakdowns and static or dynamic observation periods.
|
|
Analyzer
|
Downsampling
|
This function enables you to show a selected amount of data points. It's useful for very large data sets.
|
|
Analyzer
|
Merge Chart Types
|
When creating charts with several measures, it's useful to apply different chart types to show dependencies.
|
|
Analyzer
|
Conditional Formatting
|
Define rules to apply selected colors based on fixed, relative or custom criteria to your charts and tables.
|
|
Analyzer
|
Comparison Period
|
Compare data series to different past timeframes such as the previous period or same period previous year.
|
|
Analyzer
|
Sorting Results
|
Change the default sortation of the measured values to a custom order to get the visual illustration you need.
|
|
Analyzer
|
Chart Value Options
|
Easily show or hide single chart values with a few clicks. The referring chart legend will adjust.
|
|
Analyzer
|
Tooltips
|
Add additional information to your charts with custom tooltips (single value, multi-value or custom text).
|
|
Analyzer
|
Data Labels
|
Show or hide data labels and adjust their position and visual appearance to your individual needs.
|
|
Analyzer
|
Chart Legend
|
Adjust the position of the legend (left, right, bottom, top) as well as the font size and colors.
|
|
Analyzer
|
Chart Colors
|
Customize the chart background with different colors and choose from different gradients and grid colors.
|
|
Analyzer
|
Axis Title
|
Easily adjust your axis titles with custom text and various styling options and optional allow text wraps.
|
|
Analyzer
|
Axis Scale
|
You can edit your axis scale with selected minimum and maximum values or a specific interval.
|
|
Analyzer
|
Number Formats
|
Change the number formats including decimals, symbols, formats and units to your individual needs.
|
|
Analyzer
|
Data Series Options
|
Adjust data series types (line, area, stream, column, bar, scatter), colors and data series lines and marker.
|
|
Analyzer
|
Secondary Axis
|
Add a secondary axis to your chart to visualize two variables in the most meaningful way possible.
|
|
Analyzer
|
Advanced Table Options
|
Choose from extensive table color, layout, number format and background options for your tables.
|
|
Analyzer
|
Drilldown Options
|
Add interactivity to your charts by using drilldowns to easily drill into a lower level of the X-axis.
|
|
Analyzer
|
Trend Indicators
|
Choose from a variety of trendlines such as power, exponential, linear, logarithmic, polynomial or best fit.
|
|
Analyzer
|
KPI Creation
|
Build custom Key Performance Indicators (KPIs) with a few clicks and get inspired by 250+ examples.
|
|
Analyzer
|
Alerts
|
This allows you to set up automated alerts based on thresholds, neuronal networks or pattern recognition.
|
|
Analyzer
|
Predictive Analytics / Forecasting
|
Use our built-in predictive analytics to predict future outcomes, without in-depth data analysis skills.
|
|
Analyzer
|
Exporting Options
|
Easily export your charts in different file formats, including XLS, PDF, PNG & CSV.
|
|
Dashboard
|
Dashboard Templates
|
Benefit from over 80 professional dashboard templates for different functions, industries and platforms.
|
|
Dashboard
|
Cross-Device Accessibility
|
Our dashboards can be accessed from anywhere, anytime, from any device, including smartphones.
|
|
Dashboard
|
Global Style Options
|
This enables you to easily adjust the appearance of any visual element of your dashboard with a few clicks.
|
|
Dashboard
|
Predefined Design Themes
|
Benefit from a wealth of predefined design themes to make your dashboard visually appealing.
|
|
Dashboard
|
Chart Collocation
|
Flexible arrange all your charts on your dashboard without any limitations and use multiple plains.
|
|
Dashboard
|
Images
|
Upload and implement custom images to create a unique look and feel for your dashboard design.
|
|
Dashboard
|
Icon Library
|
Simply search and select out of thousands of icons, and make basic edits such as changing colors.
|
|
Dashboard
|
Text Boxes
|
Apart from numbers and charts on your dashboard you can use textboxes for additional written information.
|
|
Dashboard
|
Filter Text Boxes
|
Display filter values on your dashboard using dynamic textboxes, which is particularly useful for exporting.
|
|
Dashboard
|
Dashboard Tabs
|
Create dashboard tabs to group charts into individual categories for a better structure of your analyses.
|
|
Dashboard
|
Consolidate Dashboard Tabs
|
Send individual tabs to other dashboards and thereby fully integrate one dashboard in another.
|
|
Dashboard
|
Global / Drillthrough Filter
|
Drillthrough filters give you predefined filter options that affect the data displayed on the whole dashboard.
|
|
Dashboard
|
Click to Filter
|
You can select values that are already in a chart and filter the dashboard according to this particular value.
|
|
Dashboard
|
Hierarchical Filter
|
Connect multiple filters, so that the selection from one filter influences the selection of another.
|
|
Dashboard
|
Cross Tab Filter
|
This allows you to set up filters that get dynamically synchronized and applied in multiple dashboard tabs.
|
|
Dashboard
|
Ignore Filter
|
This enables you to ignore filters that are applied on a dashboard and exclude a chart from selected filters.
|
|
Dashboard
|
Drill-Through
|
Show additional, more specific, and detailed information of a particular element, variable, or KPI.
|
|
Dashboard
|
Drilldown
|
This interactive option enables you to drill into a lower level of the X-axis of a selected data visualization.
|
|
Dashboard
|
Time Interval Widget
|
Choose from different time intervals of the data displayed in a single chart (e.g. daily, weekly, monthly).
|
|
Dashboard
|
Dynamic Elements
|
Dynamic textboxes or images, that are triggered on custom rules, add interactivity to your dashboards.
|
|
Dashboard
|
Chart Zoom
|
Display a lower time hierarchy in time scale charts, e.g. zoom from year by month to month by day.
|
|
Dashboard
|
Show Data
|
This option enables you to look always at the underlying raw data of any chart that you're exploring.
|
|
Dashboard
|
Widget Linking
|
Increase the informative content of your dashboard by adding links to other dashboards or external links.
|
|
Dashboard
|
Information Tooltips
|
Add explanations or additional information to text boxes & images in form of a popup, e.g. a definition.
|
|
Dashboard
|
Printing Bounds
|
This useful feature helps you to align your dashboard to a required export format with a few clicks.
|
|
Dashboard
|
KPI Scorecards
|
Enjoy a wealth of functions to build professional KPI scorecards for effective KPI monitoring.
|
|
Dashboard
|
Preview Mode
|
The preview mode offers the possibility to check your changes on your dashboard before saving them.
|
|
Dashboard
|
Presentation Mode
|
This feature allows you to share your dashboards in full-screen, especially powerful for presentation.
|
|
Dashboard
|
Fullscreen Tab Rotation
|
Set up a fullscreen dashboard tab rotation in an individual defined time interval (e.g. 30 seconds).
|
|
Dashboard
|
Animation Options
|
Select from many different animation options, that are shown when the charts of your dashboards are loaded.
|
|
Dashboard
|
Tab Refresh Interval
|
Select an individual refresh interval for every single dashboard tab based on your information need.
|
|
Dashboard
|
Mobile Mode
|
Create a customized mobile view for any dashboard in your account for a great mobile user experience.
|
|
Dashboard
|
Real-Time Notifications
|
Add custom alerts to single charts on your dashboard to keep full control of what drives your business.
|
|
Dashboard
|
Duplicate Dashboard
|
Easily clone a dashboard before you start editing it, just in case to have a backup version.
|
|
Dashboard
|
Duplicate & Migrate Dashboard
|
Connect an existing dashboard to a new, different data source and build a faster analysis process.
|
|
Dashboard
|
Exporting Options
|
Easily export your dashboard in different file formats, including XLS, PDF, PNG & CSV.
|
|
Dashboard
|
Share via Email
|
When exporting a dashboard tab, you also have the option to easily share this content via email.
|
|
Dashboard
|
Share via Link
|
Recipients can simply access the dashboard via a generated URL. The link can be password-protected.
|
|
Dashboard
|
Share in Viewer Platform
|
Share dashboards with viewers on a separate platform, where they can use individually assigned filters.
|
|
Dashboard
|
Embedded Dashboards
|
Embed our dashboards via an Iframe in other business applications, external portals or websites.
|
|
Dashboard
|
White Label Options
|
datapine offers a wide range of white label options for your individual reporting needs (client reporting etc.).
|
|
Dashboard
|
Mobile App
|
We offer a standalone mobile app for Android and iOS, where you can access your mobile dashboards.
|
|
Dashboard
|
Short Cuts
|
You can use many common shortcuts to work faster and more efficiently when creating your dashboards.
|
|
Dashboard
|
User Role Management
|
datapine has 4 user roles to meet your individual requirements: admin, editor, viewer and power viewer.
|
|
Report
|
Share via Link
|
Recipients can simply access the dashboard via a generated URL. The link can be password-protected.
|
|
Report
|
Share in Viewer Platform
|
Share dashboards with viewers on a separate platform, where they can use individually assigned filters.
|
|
Report
|
Embedded Dashboards
|
Embed our dashboards via an Iframe in other business applications, external portals or websites.
|
|
Report
|
Mobile App
|
We offer a standalone mobile app for Android and iOS, where you can access your mobile dashboards.
|
|
Report
|
Standard Email Report
|
A standard report sends the same information to all recipients. This report is used by most of our clients.
|
|
Report
|
Customized Email Report
|
A customized report sends your dashboard to a group of recipients, each with recipient-specific content.
|
|
Report
|
User Role Management
|
datapine has 4 user roles to meet your individual requirements: admin, editor, viewer and power viewer.
|
|
Report
|
User-Specific Filters
|
User-specific filters will change the data of the shared dashboard individually for every recipient.
|
|
Report
|
Ad-hoc Reports
|
Thanks to easy-to-use BI features business users can create ad-hoc reports with just a few clicks.
|
|
Report
|
Automated Reports
|
We offer all the functions to automate your reports with ease, from advanced scheduling to filter options.
|
|
Report
|
Report Format
|
You can select to send the dashboard to the recipients in these formats: XLS, CSV, PDF or PNG.
|
|
Report
|
Report Text Options
|
You can add to every report an individual subject and a message, to customize your automated Email reports.
|
|
Report
|
Content Scope
|
You can flexibly choose to share a whole dashboard or just single selected dashboard tabs.
|
|
Report
|
Content Timeframe
|
Define for which timeframe (e. g. yesterday, last week) the dashboard should be filtered for the report.
|
|
Report
|
Global / Drillthrough Filter
|
Global filters will affect the data on the dashboard report for every recipient in the same way.
|
|
Report
|
Schedule Options
|
Choose between different report intervals (e.g. daily, weekly, monthly) & schedule the exact sending times.
|
|
Report
|
White Label Options
|
datapine offers a wide range of white label options for your individual reporting needs (client reporting etc.).
|
|
Report
|
Gapless Report Management
|
Once you set up a report you can easily edit, duplicate, deactivate or delete it with a few clicks.
|
|
Built-in Prediction Tool
|
Predictive Analytics / Forecasting
|
Use our built-in predictive analytics tool to predict future outcomes, which you will find in the analyzer.
|
|
Built-in Prediction Tool
|
Input Settings
|
Define which data the forecast should be based on. Select a specific amount of data points or a timeframe.
|
|
Built-in Prediction Tool
|
Input Emphasis Options
|
You can assign higher weights to more recent periods/data points to fine-tune your forecast.
|
|
Built-in Prediction Tool
|
Output Settings
|
With this prediction feature you can define how many data points or which timeframe should be forecasted.
|
|
Built-in Prediction Tool
|
Confidence Intervals
|
Choose between various confidence intervals between 50 to 99%, which will affect the forecast range.
|
|
Built-in Prediction Tool
|
Model Quality
|
This feature will show you the model quality on a business user-friendly scale from F to A+.
|
|
Built-in Prediction Tool
|
Custom Label Options
|
You can assign custom labels to your forecast series and choose between different label types.
|
|
Built-in Prediction Tool
|
Preview Forecast
|
Before applying your changes you have a forecast preview to fine-tune your input and output settings.
|
|
Built-in Prediction Tool
|
Forecast Range
|
Beside the exact forecast value you get a range with a lower & upper limit, based on your confidence interval.
|
|
Alarms
|
Performance Monitoring
|
Benefit from advanced performance monitoring by using different alert types for your important KPIs.
|
|
Alarms
|
Input Format
|
Here you can specify if you want to monitor hourly, daily, weekly or monthly values with your alarm.
|
|
Alarms
|
Neural Network Alert
|
This is an artificial intelligence algorithm using the most advanced neural network for anomaly detection.
|
|
Alarms
|
Pattern Recognition Alert
|
This alert is a machine-learning algorithm that aims at predicting the next expected value of a data series.
|
|
Alarms
|
Threshold Alerts
|
Define a range – absolute or relative – in which a KPI can fluctuate without actually triggering an alarm.
|
|
Alarms
|
Algorithm Sensitivity
|
For the neural network and pattern recognition alert you can adjust the sensitivity of the algorithm.
|
|
Alarms
|
Alert Insights
|
For every triggered alarm you will get additional insights such as alert accuracy or seasonality patterns.
|
|
Alarms
|
Alert Frequency
|
Specify the time interval in which the software will automatically check for new alerts (e. g. every hour).
|
|
Alarms
|
Alert Execution Time
|
By default the selected time intervals start at 0:00. You have the option to customize the checking time.
|
|
Alarms
|
Alert Emails
|
Choose between different Email formats for your alert emails that will be sent, once an alert is triggered.
|
|
Alarms
|
Alert Recipients
|
You can add, delete and manage the recipients, that will get an Email notification, once an alert is triggered.
|
|
Alarms
|
Custom Alert Notifications
|
Specify individual headlines and alarm texts for your emails, based on custom thresholds.
|
|
Alarms
|
Dynamic Tags
|
Within your alert Emails you can use dynamic tags like [value], [abs_difference] or [rel_difference].
|
|
Alarms
|
Alert Management
|
You can easily manage all your alerts and activate or deactivate them with a single click.
|
|
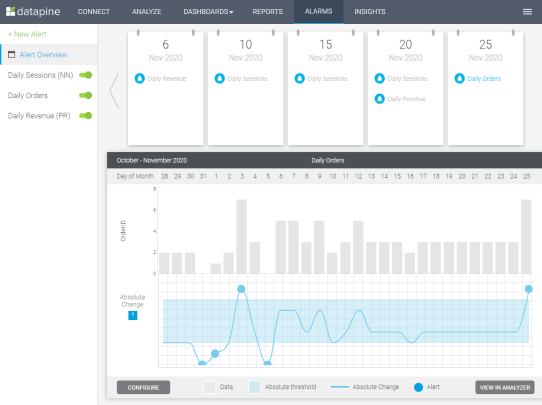
Alarms
|
Alert Overview
|
On this page you will find an overview of all triggered alerts in a weekly calendar.
|
|
Embedding
|
Dashboard Embedding
|
datapine provides you a fast and easy way to embed professional dashboards in your own application.
|
|
Embedding
|
Full BI tool embedding
|
datapine offers the possibility to embed the entire BI software in any external application.
|
|
Embedding
|
SSO
|
datapine supports Single Sign-On (SSO) using JSON Web Token (JWT) for embedding in other applications.
|
|
Deployment (all modules)
|
SaaS & On-premises
|
datapine offers a SaaS solution as well as a custom on-premises installation on request.
|