The datapine Blog
News, Insights and Advice for Getting your Data in Shape

Search Results for: kpi

Found 148 search results for kpi (this is page 20 of 30).

The Top 20 Data Visualization Books That Should Be On Your Bookshelf
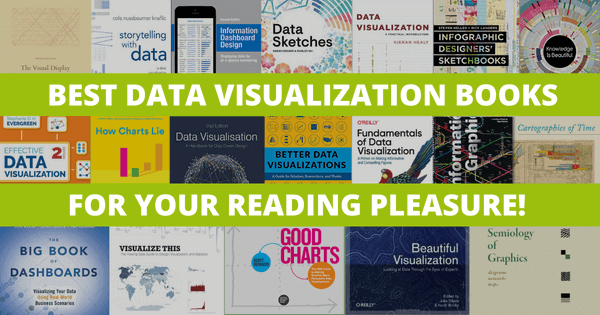
The top 20 data visualization books blog post by datapine

“Most of us need to listen to the music to understand how beautiful it is. But often that’s how we present statistics: we just show the notes, we don’t play the music.” – Hans Rosling, Swedish statistician

datapine is filling your bookshelf thick and fast. Previously, we discussed the top 19 big data books you need to read, followed by our rundown of the world’s top business intelligence books as well as our list of the best SQL books for beginners and intermediates. Now that you’re sold on the power of data analytics in addition to data-driven BI, it’s time to take your journey a step further by exploring how to effectively communicate vital metrics and insights in a concise, inspiring, and accessible format through the power of visualization.

Data visualization, or ‘data viz’ as it’s commonly known, is the graphic presentation of data. These aesthetically striking portrayals are the most effective way to succinctly translate large segments of complex data to a wide audience. Successful visualizations are aesthetically beautiful, providing layers of detail that generate deeper dimensions of insight and whole new layers of understanding. They can be fun and interactive, too.

READ MORE

Discover The Power Of Gauge Charts: Definition, Best Practices & Examples

Gauge Charts blog by datapine

Data visualization is a fundamental step for successful data analysis. By giving your information a visual context, you make it more understandable. Making your insights more focused will also help you identify rafts of valuable new trends, patterns, or problems. 

There are many chart types available in today’s digital realm and each one of them plays an important role in a professional BI dashboard. To choose the perfect mix of visualizations, you need to know exactly what story you want to tell with your data and what visual tool will be the best to do so. 

In this essential guide, we will introduce you to one of the most straightforward yet potentially powerful types of data visualization, the gauge chart.

READ MORE

A Guide To Performing Successful Content Reporting Using Modern Dashboards

Content reporting blog post by datapine

As a content manager, you most likely spend most of your time writing quality blogs, email newsletters, and social media posts, all in an effort to ensure the business is growing and achieving its goals. That said, measuring the success of your those efforts is another great part of the job, and on many occasions, it can prove to be overwhelming as you need to use multiple tools to gather the data. Enter modern content reports. 

Modern content performance reports in the shape of an interactive online dashboard present an intuitive and accessible way to assess your content’s success and its ROI in real-time and in one centralized location. To get you started on the topic, we’ve put together this guide including definitions, benefits, examples, and a list of best practices. Let’s get started!  

READ MORE

Unlock The Power of Your Data With These 19 Big Data & Data Analytics Books

Visual overview of big data and data analytics books

The saying “knowledge is power” has never been more relevant, thanks to the widespread commercial use of big data and data analytics.

This trend has been brought about by the new demands of the modern marketplace, and it’s here to stay. The rate at which data is generated has increased exponentially in recent years. To put this into perspective, 40,000 search queries are performed per second via Google alone – this equates to 3.46 million searches per day and 1.2 trillion each year.

READ MORE

Accelerate Your Business Performance With Modern IT Reports

IT reports blog post by datapine

In the modern age, your IT department is a part of your business’s core nerve center. Without it, your organization would fall apart pretty quickly.

But, akin to many other industries, the information technology sector faces the age-old issue of producing IT reports that boost success by helping to maximize value from a tidal wave of digital data. While integral to organizational success and development, without the ability to gain actionable insights from your most important insights, IT reporting could be considered somewhat of a fruitless exercise.

READ MORE