The datapine Blog
News, Insights and Advice for Getting your Data in Shape

Blog Posts by author: Sandra Durcevic

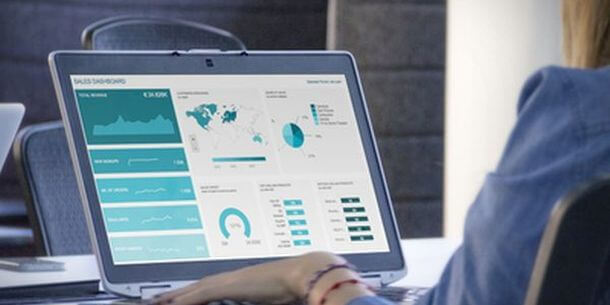
Take Advantage Of Mobile Dashboards – Examples & Selected Designs

Mobile dashboard examples and designs

We live in a mobile world. According to the statistics portal Statista, there are currently around 4.78 billion mobile device users worldwide. No longer are we bound by the shackles of cumbersome desktop PCs or one specific geographical location to conduct research or complete online data analysis or other important online tasks. In this hyperconnected age, it’s possible to connect, campaign, and produce from anywhere you may be in the world – and the mobile revolution is responsible for this seismic shift.

Mobile technology has changed the way we interact with the world around us, and when it comes to analyzing valuable business insights, mobile dashboards offer the freedom and flexibility to turn stats into success while you’re on the go.

Here, we will consider what a mobile dashboard is, the dashboard mobile design, making visualizations on mobile, and real business examples to explain the benefits this most flexible of data-driven technology can offer your business.

READ MORE

KPI Management And Best Practices: How To Find The Perfect KPI Solutions?

KPI management and KPI best practices guide

“If your only tool is a hammer, every problem looks like a nail.” – Abraham Maslow

Fact: 100% of the statistics strategically placed at the top of blog posts are a direct result of people studying the dynamics of Key Performance Indicators, or KPIs.

An even more interesting fact: the blogs we read on a regular basis are not only influenced by KPI management but concerning content, style, and flow, they’re often molded by the suggestions of these goal-driven metrics.

Catchy headlines, backlinks to relevant influencer content, the seamless placement of a numbered or bulleted list – and visuals, visuals, visuals are some of the key drivers of successful digital content. But these tactics and elements are not crafted out of thin air, nor are they sung by the high council of Silicon Valley; they are created by us, the readers. It’s our consumer demands that are communicated to businesses via KPI examples, dictating how the brands or businesses craft and develop the content they publish.

READ MORE

The 5 Digital Marketing KPIs & Metrics You Need To Track For More Revenue

The top 5 digital marketing KPIs

In business, Key Performance Indicators (KPIs) help you see the big picture and evaluate your strategies to better adjust them. There are many different KPI examples that you can use to track and evaluate a company’s success. Measuring digital marketing KPIs is one of the crucial functions of a marketing department. Why?

Because digital marketing, more than any other form of marketing, thrives on the proper use of KPIs. With digital marketing, almost everything is quantifiable. You can see how much your marketing strategy is costing you each step of the way and understand how much Return on Investment you’re getting. However, along with this ability to quantify, challenges and questions arise. Some of these challenges include:

  • What are the Key Performance Indicators for digital marketing?
  • Will these online marketing KPIs accurately reflect your “wins and losses” in the real world?
  • How can you “move the dial” on these KPIs in a positive way?

READ MORE

Data Science vs Data Analytics – Everything You Need To Know

Data science vs data analytics

At present, more than 3.7 billion humans use the internet. Moreover, we humans create 2.5 quintillion bytes of data every single day – a number that is expected to grow exponentially with each passing year.

Data never sleeps and in today’s world, without utilizing the wealth of digital information available at our fingertips, a brand or business risks missing vital insights that can help it grow, scale, evolve, and remain competitive.

Concerning the collection, understanding and handling of digital data, there are two key disciplines that currently lead the way: data science and analytics. Although these two fields cross over, and share many of the same characteristics, the two are strikingly different in many ways.

That said, to spare you any confusion and offer you a clearcut insight into these two innovative fields, here we explore data science vs data analytics in a business context, starting with an explanation of the science.

READ MORE

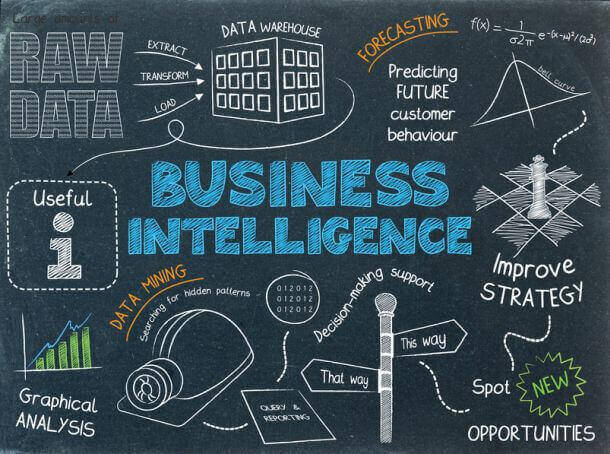
Getting Started With Big Data Analytics & Business Intelligence For Small Business

business intelligence for small business

In the past, business intelligence was a privilege of large companies who could afford to maintain teams of IT specialists and data scientists. But in the last decade, as technology has developed rapidly, the software has become not only more lightweight and powerful but also more accessible. Small businesses can use the same tools as main market players and face their competitors. New self-service tools prove that business intelligence is no rocket science but rather a useful tool to help to turn data into informed decisions. Now every company can harness the power of modern BI software to raise their bottom line since business intelligence for small business has become accessible and affordable. But what exactly makes business intelligence indispensable?

To get started in this journey, it is essential to know that BI can be adapted to any business model or industry. We have seen in our other blog posts, on how to build a successful business intelligence strategy, or harnessing the power of financial reporting and analysis, how to leverage the power of a modern business dashboard and make the most out of your small business data analytics. A need for a large department gathering and analyzing all the data gathered, circling those data in different departments, and showing it to many stakeholders it’s a model of the past. In this digital age, accessing your data in almost real-time is of crucial importance if you want to stay on top of the market. That being said, a majority of reports and analysis needed to make quick, informed, detailed and robust decisions, can be accessed within few clicks, shared with a simple link, and analyzed via simple charts that can make business decision-making process and action time much faster.

READ MORE